Track Your PyTorch Geometric Machine Learning Experiments with Weights & Biases
Entertainment

Track Your PyTorch Geometric Machine Learning Experiments with Weights & Biases
Getting started with machine learning experiments tracking can be seamless and quick! In this guide, Chris Van Pelt, co-founder of Weights & Biases (W&B), walks us through how to integrate W&B with PyTorch Geometric in just under a minute. Let’s break down the steps you need to follow:
Step 1: Install W&B
Begin by installing the Weights & Biases library. You can do this using pip:
pip install wandb
Step 2: Import Necessary Libraries
Next, import the necessary libraries in your Python script:
import wandb
import torch
import torch_geometric
Step 3: Initialize a New W&B Run
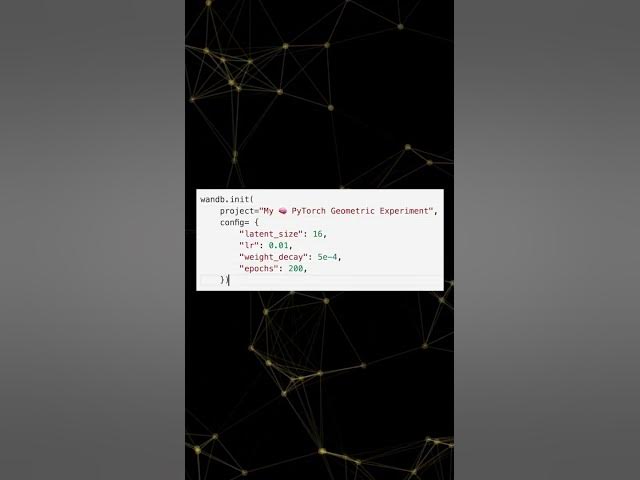
Initialize a new W&B run along with some hyperparameters for your experiment:
wandb.init(project="your-project-name", config=(
    "learning_rate": 0.01,
    "epochs": 100,
    "batch_size": 64
))
Step 4: Set Up Your PyTorch Model
Set up your PyTorch model using PyTorch Geometric graph convolution layers and reference wandb.config to ensure reproducibility:
import torch.nn as nn
import torch_geometric.nn as pyg_nn

class GCN(nn.Module):
    def __init__(self):
        super(GCN, self).__init__()
        self.conv1 = pyg_nn.GCNConv(input_dim, hidden_dim)
        self.conv2 = pyg_nn.GCNConv(hidden_dim, output_dim)

    def forward(self, data):
        x, edge_index = data.x, data.edge_index
        x = self.conv1(x, edge_index)
        x = torch.relu(x)
        x = self.conv2(x, edge_index)
        return x

model = GCN()
optimizer = torch.optim.Adam(model.parameters(), lr=wandb.config.learning_rate)
criterion = nn.CrossEntropyLoss()
Step 5: Define Your Training Loop
Define your training loop and use wandb.log to track your training loss:
def train():
    model.train()
    for epoch in range(wandb.config.epochs):
        optimizer.zero_grad()
        out = model(data)
        loss = criterion(out, data.y)
        loss.backward()
        optimizer.step()
        wandb.log(("epoch": epoch, "loss": loss.item()))

train()
The Coolest Part: Log Graph Visualization
Logging your favorite graph visualizations is as easy as adding one line:
wandb.log(("graph": wandb.Image(your_graph_visualization)))
Conclusion
That's it! Now you can see metrics and graph visualizations flowing into your interactive dashboard. You’ll also see your hyperparameters in the runs table. For the best experience, sign up for an account at W&B sign-up page.
Keywords
- Weights & Biases (W&B)
- PyTorch
- PyTorch Geometric
- Machine Learning
- Graph Neural Networks
- Experiment Tracking
- Hyperparameters
- Training Loop
- Model Logging
FAQ
1. How do I install Weights & Biases?
You can install Weights & Biases using pip with the command:
pip install wandb
2. Which libraries do I need to import for tracking PyTorch Geometric experiments with W&B?
You need to import wandb, torch, and torch_geometric.
3. How do I initialize a new W&B run?
You can initialize a new W&B run using the following command:
wandb.init(project="your-project-name", config=("learning_rate": 0.01, "epochs": 100, "batch_size": 64))
4. What is the basic structure of a PyTorch Geometric model for graph convolution layers?
The basic structure involves defining a model class that includes graph convolution layers:
import torch_nn as nn
import torch_geometric.nn as pyg_nn

class GCN(nn.Module):
    def __init__(self):
        super(GCN, self).__init__()
        self.conv1 = pyg_nn.GCNConv(input_dim, hidden_dim)
        self.conv2 = pyg_nn.GCNConv(hidden_dim, output_dim)

    def forward(self, data):
        x, edge_index = data.x, data.edge_index
        x = self.conv1(x, edge_index)
        x = torch.relu(x)
        x = self.conv2(x, edge_index)
        return x
5. How can I log training loss with W&B?
You can log training loss inside your training loop using the following command:
wandb.log(("epoch": epoch, "loss": loss.item()))
6. How do I log graph visualizations in W&B?
Logging graph visualizations in W&B can be done with:
wandb.log(("graph": wandb.Image(your_graph_visualization)))
This guide should help you get started with tracking your machine learning experiments efficiently using W&B and PyTorch Geometric!

